
Processes that recur over time are a fundamental part of our environment. The natural sciences are therefore devoted to describing and understanding them, and refer to them as oscillations. When oscillations occur in elastic, i.e. reversibly deformable, media, this is called sound.
Elastic media include solids as well as liquids and gases. In everyday life and in noise control, airborne sound plays the main role. At the microscopic level, the oscillations take place as displacements of the air molecules (nitrogen, oxygen, carbon dioxide, …), superimposed on their random thermal motion that is present anyway.
Technically more relevant, however, is the macroscopic view: here sound is described as fluctuations in density and pressure around the ambient pressure. As this disturbance propagates through space, the sound pressure depends on both location and time. A spatially propagating disturbance of this kind is called a wave. Wave characteristics form the basis of the mathematical and physical description of sound phenomena.
A central physical approach is that of energy: sound can transport energy, which is converted into other forms of energy (e.g. heat or mechanical work) in the medium and at structures. The energetic view of sound fields is complex because pressure varies in space and time simultaneously: a distinction is made between sound power P (unit W) and sound intensity I (unit W/m2).
Sound power P is the total sound energy that a source emits into the surrounding medium per unit of time, while sound intensity I relates this power to an area and thus describes the local energy flow per square metre. For sources at a large distance, i.e. in the so-called far field, the intensity is approximately proportional to the square of the sound pressure p, which in practice can be measured with a microphone.
From the outer ear to the cochlea
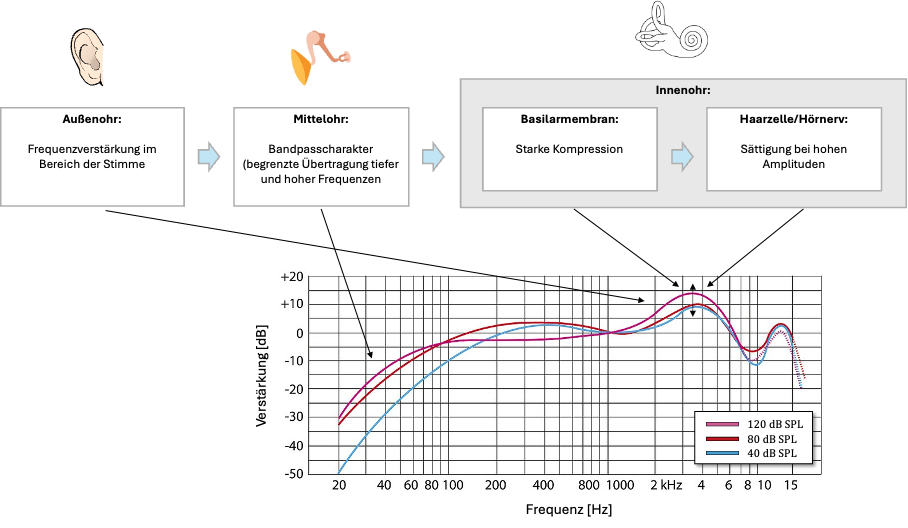
The ear is the human sensory organ responsible for measuring sound. Anatomically, it is divided into the outer, middle and inner ear (Figure 1). The auricle (Latin pinna) has a characteristic shape that amplifies incoming sound waves depending on frequency and direction. Together with the ear canal, this results in a frequency-dependent amplification that is particularly pronounced in the speech range of around 2–5 kHz. The outer ear thus contributes significantly to localisation, frequency-dependent amplification and filtering of sound, even before the middle ear and the cochlea come into play.
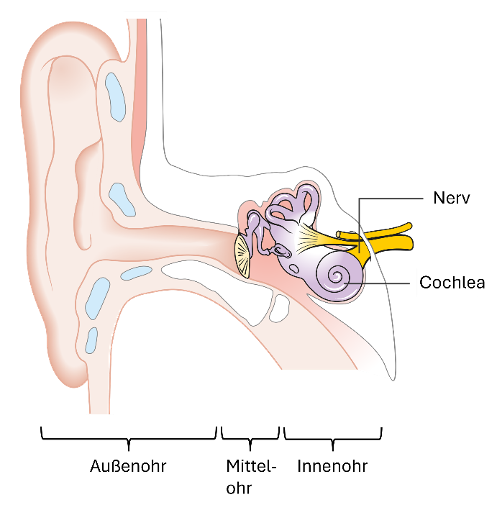
At the end of the outer ear canal, the sound strikes the eardrum, where it is converted into mechanical vibrations. In the middle ear, these movements are transmitted via the hammer, anvil and stirrup to the oval window of the cochlea. The chain of ossicles acts as a lever and transmission system: through leverage and the area ratio between eardrum and oval window, the movements are concentrated on a smaller area, producing considerably larger pressure fluctuations in the inner ear fluid.
Physically, this is a coupling of two mechanical systems. The middle ear acts as an impedance match between the air in the ear canal and the fluid in the inner ear. In this context, impedance means the “vibration resistance” of a system, i.e. how strongly it opposes a given movement or force. Without it, much of the sound energy would be reflected at the boundary. In addition, the middle ear can slightly dampen transmission in response to very strong stimulation (stapedius or middle ear reflex). This already introduces a further slight non-linearity here, before the much stronger effects in the inner ear set in.
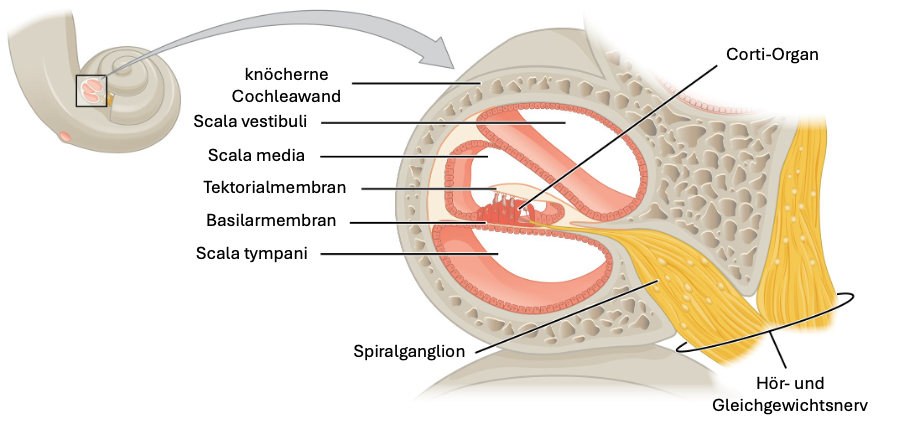
Three elongated chambers (scala vestibuli, scala media, scala tympani) run through the fluid-filled cochlea, separated from each other by membranes (Figure 2). The organ of Corti, with the inner and outer hair cells, sits on the basilar membrane between the scala media and the scala tympani; together they form the actual sensory organ for sound. The inner hair cells act as the measuring instrument: they convert the mechanical displacement of the basilar membrane into electrical nerve impulses and are thus the transducers from mechanical to neural information.
The cochlea as a mechanical Fourier transform

The mechanical properties of the basilar membrane (mass, stiffness, damping) change continuously along the cochlea: near the base it is narrow and stiff, towards the apex wider and softer (Figure 3). When stimulated at the oval window, a travelling wave arises in the inner ear fluid, i.e. a moving deformation that passes over the basilar membrane from the base to the apex. Depending on frequency, this wave reaches a maximum at a certain location and then collapses. This creates frequency-specific areas of maximum displacement, often described in simplified terms as “resonance points”. Overall, this results in a tonotopic arrangement: high frequencies have their maximum effect towards the base, low frequencies towards the apex. Functionally, the cochlea thus behaves like a filter bank with many overlapping frequency channels: the incoming signal is first split mainly into frequency components, regardless of how strong the stimulation is at the moment.
From a mathematical point of view, this is remarkable: the Fourier transform, a central concept from the 18th and 19th centuries, describes how any time signal can be decomposed into a superposition of (sine and cosine) oscillations of different frequencies. The cochlea implements exactly this principle in mechanical form. Instead of performing a Fourier transform digitally and abstractly, the auditory system projects the sound signal spatially onto the basilar membrane: at each position, the frequency range for which the local properties of the membrane are resonant preferentially “lands”. The filter bank structure of the cochlea is thus the biological counterpart to the frequency-dependent decomposition of a signal performed in technical signal processing with spectral analyses and filter banks.
Non-linearity and compression
Together with the hair cells, the basilar membrane forms a coupled oscillating system. The movement of the membrane bends the hairs of the sensory cells; the inner hair cells convert this displacement into electrical receptor potentials and thus into neural output of the auditory nerve, while the outer hair cells in particular act back actively on the membrane by changing their length, thereby feeding energy into the system. Weak oscillations are thus strongly amplified, whereas stronger stimulation is amplified comparatively little. Doubling the physical stimulation therefore does not double the internal response but leads to a much smaller increase: the system behaves in a markedly non-linear way and shows a compressive characteristic, in which increases in the input produce less and less additional increase in the output.
This behaviour is reflected in the signal passed to the brain via the auditory nerve: with very small stimulation, activity is low; in a middle range, a change in stimulation leads to clearly different response patterns; and with very strong stimulation, activity changes only slightly, which is called saturation of the system. In addition, the auditory system evaluates not only the strength but also the time course of the signal. This includes finer non-linearities such as the synchronisation of nerve impulses with the oscillation at low frequencies (phase locking) and sensitivity to amplitude modulation. One result of all these processes is a condensed, frequency- and time-dependent internal representation of sound that differs considerably from a simple linear mapping of the sound pressure.
From perception to measured quantity
In measurement practice, the properties of the ear described in this article, i.e. frequency-dependent filtering, stimulation-dependent compression and temporal processing, are reproduced only approximately. In immission control, this is essentially done with logarithmic parameters with defined frequency and time weighting. The starting point is the sound pressure level Lp, which maps the RMS value of the sound pressure onto a logarithmic scale and thus, similar to the compressive characteristic of the cochlea, compresses a very large dynamic range into manageable figures. Applying A-weighting results in the A-weighted level LA, whose frequency response approximately traces the frequency-dependent sensitivity of the ear (see Figure 4). Time weighting (e.g. “fast”, “slow” or “impulse”) additionally introduces a defined temporal averaging and thus models, to a limited extent, the integration time and inertia of auditory processing.
TA Lärm uses as its central parameter the A-weighted equivalent continuous sound level LAeq, i.e. the energy-averaged A-weighted level over the assessment period T. Supplemented by penalties for tonality, impulsiveness and particular disturbance, this yields the rating level Lr, which is used for the legal assessment. Lr thus incorporates three essential aspects of hearing: logarithmic level formation (level compression), frequency-dependent sensitivity (A-weighting) and temporal integration (averaging over the period T). DIN 45680 extends this approach in the low-frequency range by considering one-third-octave band levels between about 10 Hz and 80 Hz and comparing them with frequency-dependent, tabulated hearing thresholds. The evaluation of the individual one-third-octave bands relative to these thresholds ties in directly with the frequency- and level-dependent hearing threshold. A-weighting, time weighting, equivalent continuous sound level, one-third-octave bands and rating level are thus deliberately simplified, technically manageable projections of the much more complex signal processing of the ear.
Conclusion
Measurement technology generally aims to represent a physical quantity (e.g. pressure p) as objectively as possible, i.e. linearly, without weighting and reproducibly. The ear, by contrast, provides non-linear, evolutionarily optimised signal processing in the form of an abstract representation of information. In the brain, this information is then processed further and integrated with experiences, expectations, feelings, affects and other factors, thus forming the perception of sound. It is therefore less about a neutral image of the outside world than about capturing information relevant for action.
This leads to an insight that surprises many: the greatest challenge in noise and immission control today no longer lies in the physical description of sound, which is largely well understood, but in people. The complex signal processing in the ear and further processing in the brain lead to a highly non-linear, context-dependent perception. This perception must be translated into technically measurable and legally manageable parameters and quantified in such a way that the rights and freedoms of the different parties concerned can be weighed against each other.

Mika Wihanto works as a freelance engineer for the Centre for Acoustic Measurement Technology. He studied microsystems engineering at the University of Freiburg and is currently completing a master's degree focusing on circuits and systems, in particular systems and control engineering and technical acoustics.