Recording sources systematically
Stationary and mobile equipment: machinery, production plants, ventilation and air conditioning, lifts, heating systems and other installations.

Systematic recording, spectrographic analysis and targeted location of noise sources, the basis of any effective noise reduction.
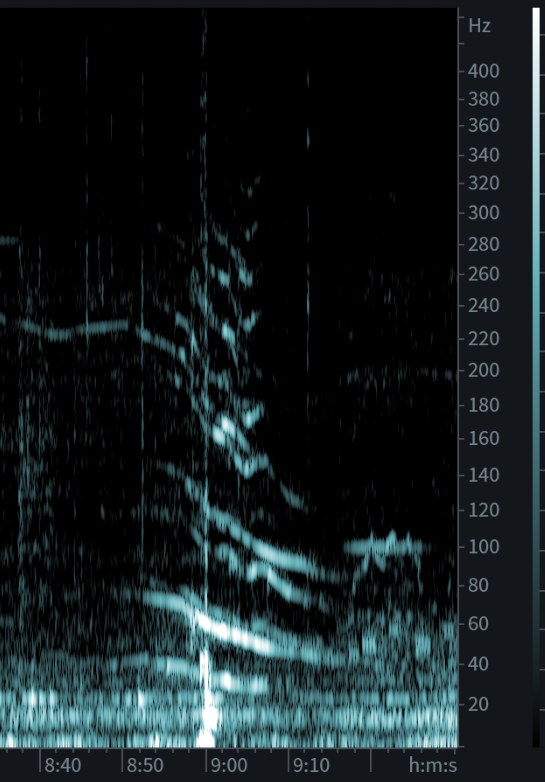
It usually starts with an observation without a number: a hum in the bedroom, a whistle at the façade, a noise that only occurs at night. A measurement initially provides an overall level, which often appears unremarkable even though the disturbance is real.
This is exactly where analysis comes in. It breaks the signal down into its spectral components, assigns them to a source and identifies which component causes the disturbance. A complaint thus becomes a finding that can be worked with.
To do this, we evaluate one-third-octave and FFT spectra and check tonality and impulsiveness, which are added to the rating level as penalties under TA Lärm. For low-frequency components, we compare the one-third-octave band levels between 8 and 100 Hz with the frequency-dependent hearing thresholds of DIN 45680. If the noise only occurs intermittently, a long-term recording over several days is added.
If the origin cannot be identified straight away, a systematic search follows, including structure-borne sound paths through walls and ceilings. Only once the source has been established can noise be reduced in a targeted way rather than insulating on suspicion.
Stationary and mobile equipment: machinery, production plants, ventilation and air conditioning, lifts, heating systems and other installations.
We characterise noise sources by their frequency spectrum and intensity, even where the level alone reveals nothing.
If the origin cannot be identified straight away, a systematic, targeted search follows, even behind walls.
Which noise control measure delivers the greatest benefit at an acceptable cost? We assess effectiveness and economic efficiency.
Every noise consists of many frequencies at once, from low to high. The display lays them side by side: a broadband carpet of traffic, wind and building services. As a single overall figure, none of this would be recognisable.
A narrow band stands out, throughout the entire measurement period. Broadband noise does not do that. This is exactly how a tone is recognised.
Turned onto the frequency axis, it becomes clear where it sits: at 49 hertz, i.e. 49 oscillations per second, a low hum. It lies around 8 dB above the neighbouring bands.
Below it lies a second component at 24.5 Hz, the shaft speed of a fan running at 1470 rpm. 49 Hz is its first harmonic. This confirms the assignment.

Responsible for the spectral analysis of measurement data and the assignment of noise components to their sources.